About
Hello there! I'm Gina, a self-taught data analyst with a passion for using data to make a positive impact on the world. With a background in physics and a desire to explore, I dive into datasets to unravel patterns and extract valuable insights. I thrive on collaborating with diverse teams, sharing knowledge, and empowering others to harness the power of data.
Why did I choose data analytics?
During my pursuit of a Masters in Physics, I discovered that my aspirations extended beyond just exploring physics. It was when I came accross the field of data science that I realized it included all the elements I desired in my career. As I dove into the necessary skills for a data analyst, I soon realized that my physics degree had equipped me with a strong foundation. All that remained was to acquire the technical skills specific to the field.
As I immersed myself in the world of data analysis, I found great joy in learning SQL and R for data cleaning. To my surprise, I grew to deeply appreciate the careful process of refining and preparing data. Moreover, during my academic journey, I often gave presentations and enjoyed thinking about what to share and how to present it clearly to my audience. This aspect of crafting impactful presentations became one of my favorite assignments.
These experiences have shaped my path and ignited my passion for data analysis. By combining my analytical mindset nurtured through my physics background with newfound technical skills, I am ready to discover valuable insights from complex datasets. My love for data cleaning and crafting compelling presentations has only deepened my conviction to excel in the field of data analytics. I am excited to leverage my expertise, collaborate with like-minded professionals, and make a significant contribution in leveraging data to drive informed decisions and bring about positive change.
Get to know me
I hail from the vibrant coastal city of Mangalore, India, which is where I have lived all my life. Growing up here, I was immersed in a rich tapestry of cultures, tantalized by the exquisite seafood, and embraced by the serene beauty of its pristine beaches.
-My Academic Passions
As I was growing up, my fascination with math and physics was sparked at an early age, thanks to my father, who shared his enthusiasm for these subjects with me. Together, we would watch shows on physics and space, nurturing my curiosity. While I initially struggled with math, a dedicated math teacher during my Pre-university years transformed my perspective. Watching math enthusiasts on YouTube revealed the beauty and creativity of math, captivating my interest. This passion led me to pursue a master's degree in physics. I find the entire realm of physics immensely captivating, making it challenging to specialize in a single topic. In math, algebra holds a special place in my heart, and I yearn to delve deeper into various mathematical topics. My enthusiasm for science has always been a part of who I am, as I enjoy sharing fascinating scientific discoveries and concepts with others.
-My Teaching Journey
I've always found joy in helping individuals unlock their full potential and I've
have had the opportunity to share my love for math and science with students. Since 2020, while I was in college,
I've been teaching subjects ranging from math to science to students in grades 6-12, even extending
my support to a friend during his bachelor's studies to help him clear his math paper.
I take pride in the positive feedback from students and their parents, with one parent expressing
gratitude for boosting their daughter's academic confidence. My dedication to guiding students to
reach their potential has consistently yielded improved grades.
In addition to teaching, I dedicated a year as an academic support volunteer for the NGO MAD (Make A Difference).
What drew me to MAD was their holistic approach, not only focusing on exam success but also nurturing
underprivileged children into capable adults by providing them with essential support systems.
Despite the challenges, my experience with MAD offered profound insights into the lives of these
children and the obstacles they face. Being a small part of this noble effort to empower India's
underprivileged youth was a truly rewarding experience.
-Life on Campus
My college journey also included active involvement in the organisation of the national-level college fest 'Imprints' at St. Aloysius College, spanning three enriching years. In my first year, I provided support to my team by assisting with various tasks, including brainstorming questions. However, it was in my second year that I took on a more significant role, by leading the planning and creation of contest rounds, introducing innovative rounds by integrating popular games like 'taboo' and 'jenga' with science questions to blend fun and learning. On the day of the contest, I efficiently delegated tasks to volunteers for seamless execution. In my final year, as a co-head of 'Chaos,' I transitioned into a managerial role, overseeing the organization of main events and games, including a unique dog and bone event and a human-sized snake and ladder game. Though my second-year experience was challenging, it was also immensely rewarding, instilling confidence in my abilities and a preference for hands-on roles where I can bring ideas to life. This three-year journey has significantly shaped my understanding of my strengths and passions, and I aspire to continue contributing creatively in similar roles.
-Beyond Academics
My journey into the world of baking has been nothing short of an adventure. While my initial attempts at baking often resulted in amusing disasters, I vividly recall a particular incident when I baked a chocolate cake that could have doubled as a brick. However, my resourcefulness came into play as I steamed the cake, layered it with chocolate ganache, and to my surprise, it was a hit among my classmates. In my final year of college, I was invited by my neighbor and her friends to join their Christmas charity bake sale, despite my self-proclaimed 'terrible at baking' status. Their foolproof recipes and guidance allowed me to successfully bake a batch of delicious chocolate cupcakes. My favorite creations include my constant hit, the 'banana bread' and our best-selling 'Rose milk cake', where I find the process of making the sponge cake, especially watching the eggs whip into stiff peaks, particularly satisfying. While brownies have been my nemesis as I can never seem to get it right, I cherish every baking experience, knowing that each failure has contributed to my growth as a baker and as a person.
-My Hobbies
I've always been into a bunch of hobbies. As of late, I love taking care of my plants, especially my neon pothos, jade plant, purple heart, and Oxalis triangularis. I've also started doing DIY home projects, making things around the house look better. When it comes to food, I enjoy cooking vegetarian dishes, like mushroom alfredo pasta and pizza. I'm not picky about the type of cuisine, as long as it's tasty and not too hard to make. I'm also pretty artsy; I like painting, sketching, and trying different art stuff I find interesting. And I'm hoping to learn dancing, especially fast ballroom styles like jive and salsa, where you get to do fun dips, spins and lifts.
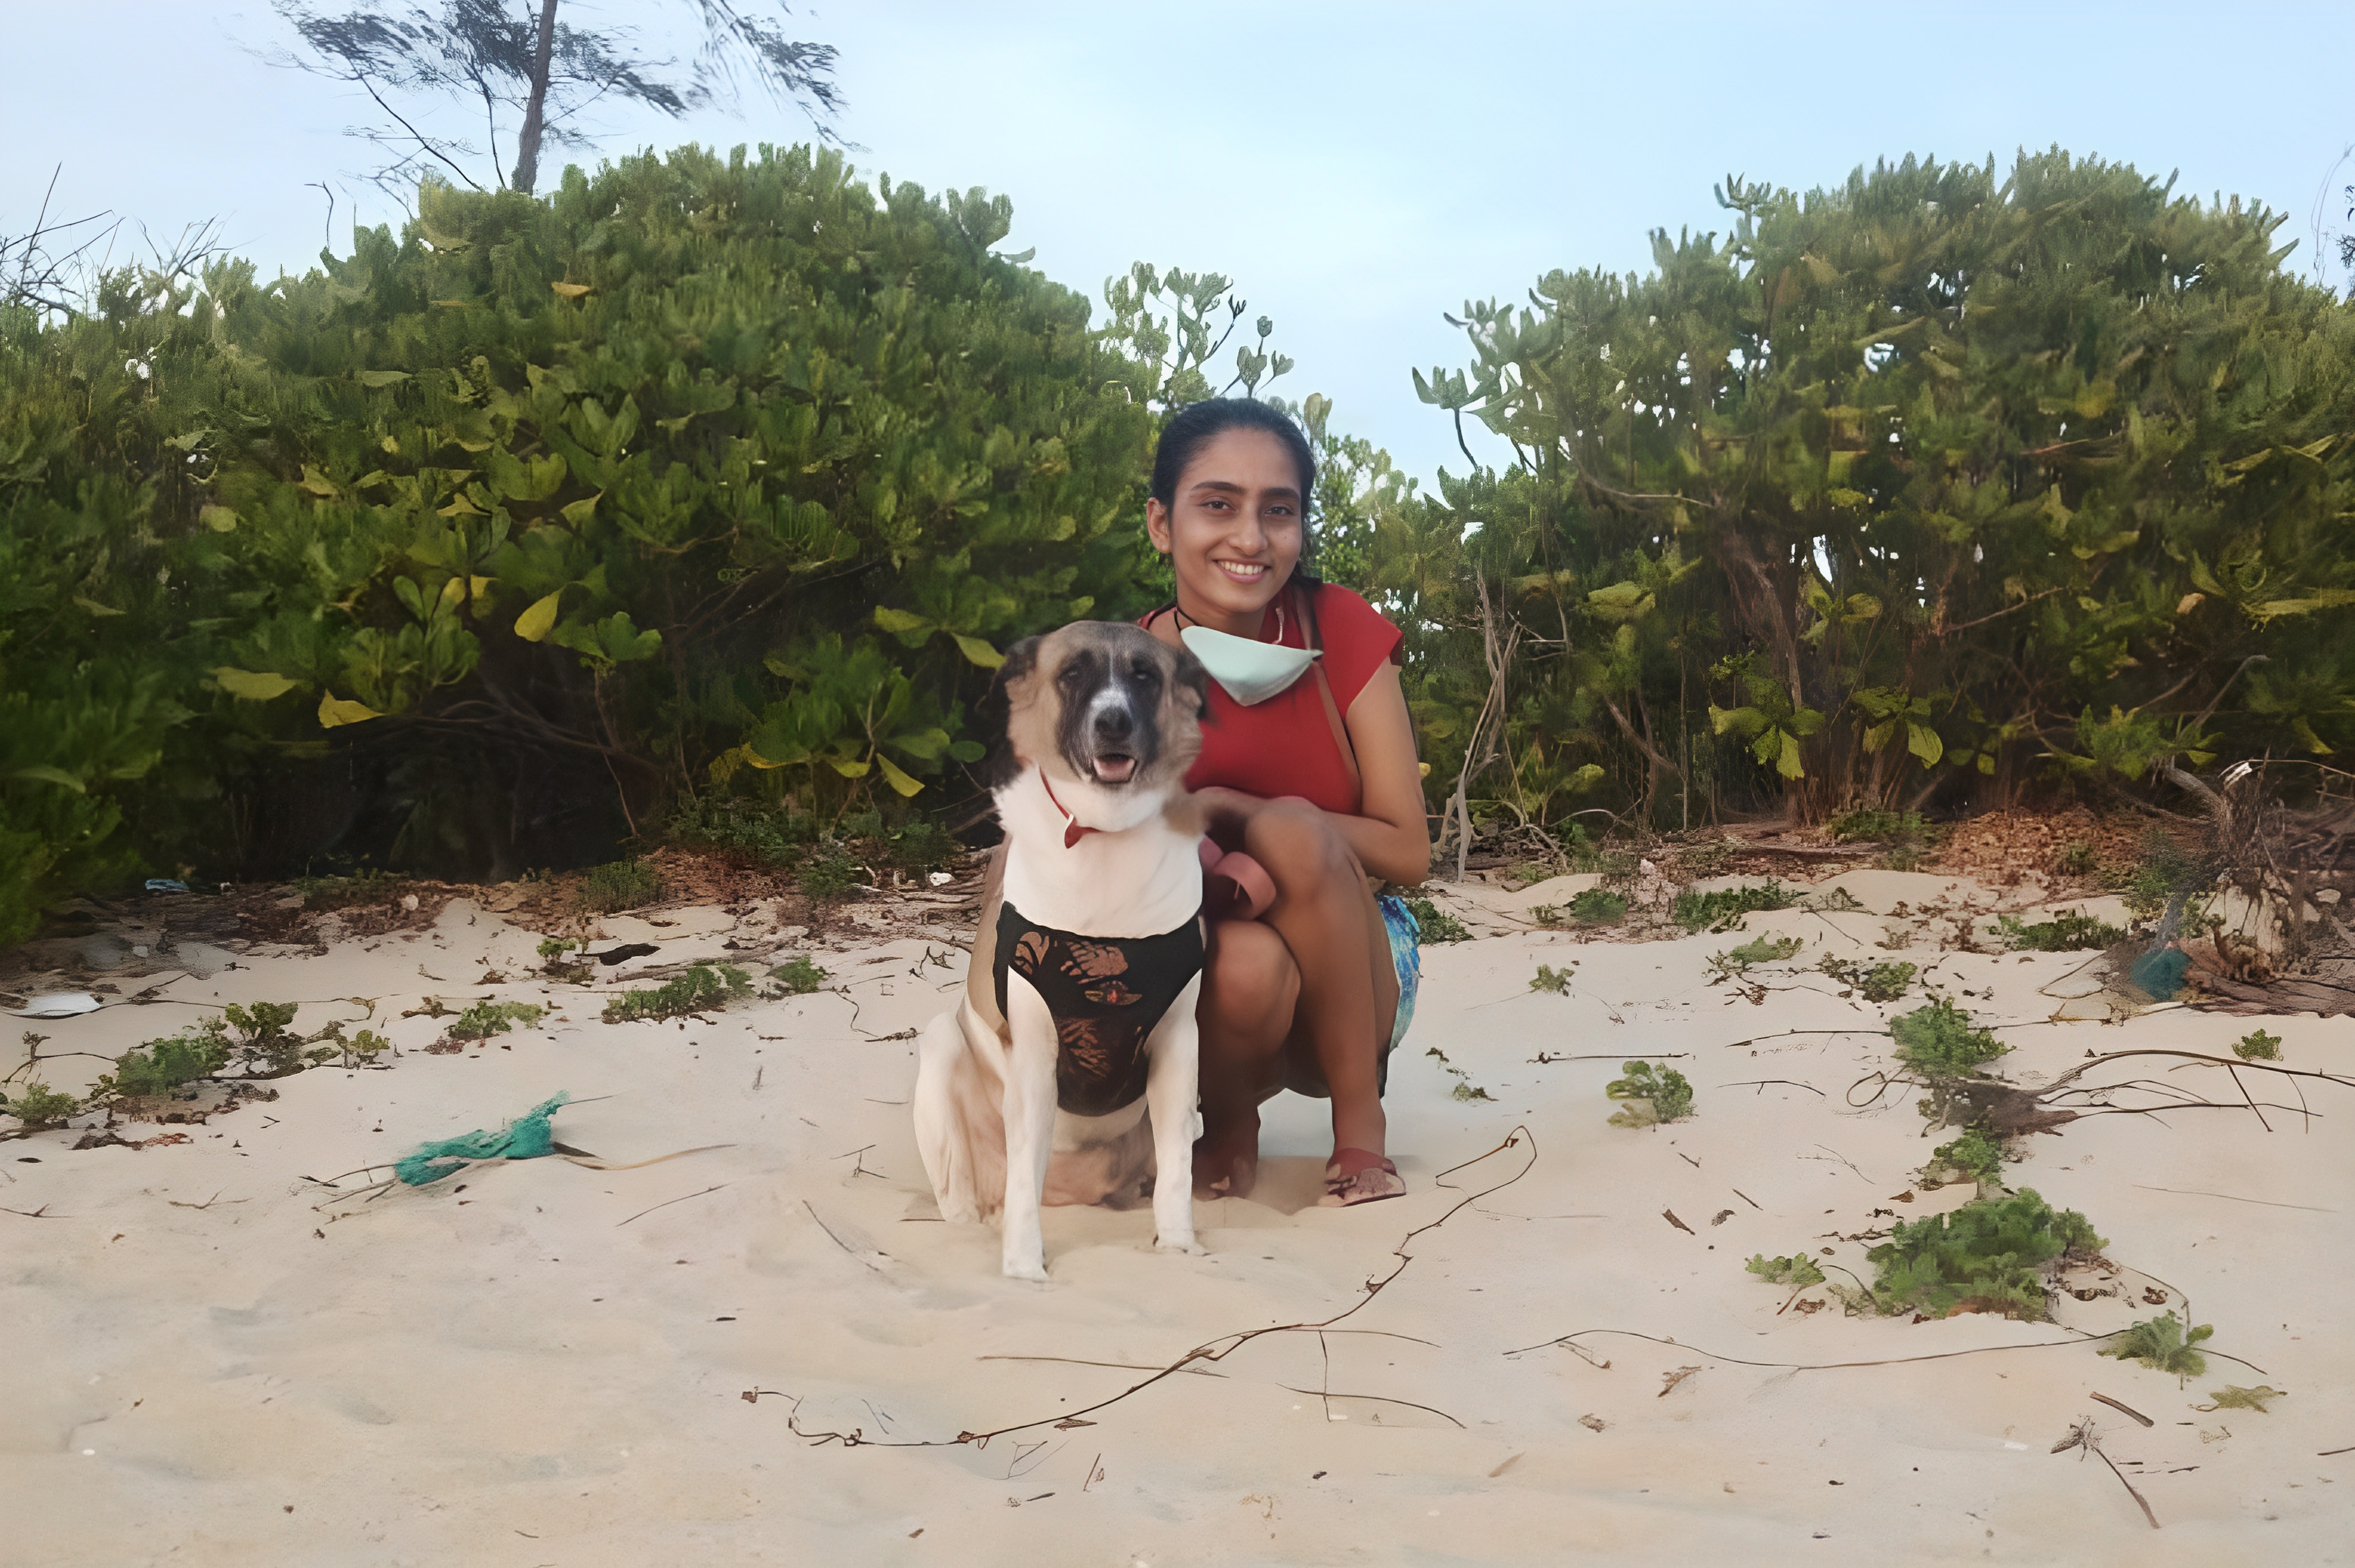
-About My Dog
In the midst of these endeavors, my dog, Pupito, adds warmth and joy to each day. Pupito, whose name is an accidental misheard version of a character's name from the movie Madeline, is our beloved Indian mutt that we adopted from the local market when he was just a puppy. He may be a senior dog now, but we are incredibly fortunate to still have him by our side. Remarkably, my journey with Pupito has transformed me from someone who once had no interest in dogs or animals into a devoted animal lover. Witnessing his unique intelligence, experiencing the purity of his love, and nurturing our special bond has been immensely rewarding. I take pride in our daily walks, where I watch him explore the neighborhood, sniffing and digging with enthusiasm. In his own way, Pupito has taught me important lessons about our connection with the animal world. While I don't have a specific hobby that revolves around Pupito, our daily walks are cherished moments of connection, making each step a delightful journey.